¶ ¶ User Manual — Dashboard
Application or layer: Portal Nomid MDM
Document: V1.0.0
Last updated: 17/06/2026
Language: en_US
The Dashboard presents the executive and operational view of the managed fleet. It brings together device indicators, policies, usage, consumption, application versions, location and attention cards so that the team can quickly identify situations that require action.
Important: Dashboard numbers depend on the data reported by the devices. Devices without recent synchronization may leave indicators incomplete or out of date.
¶ ¶ Overview
¶ ¶ Dashboard Summary
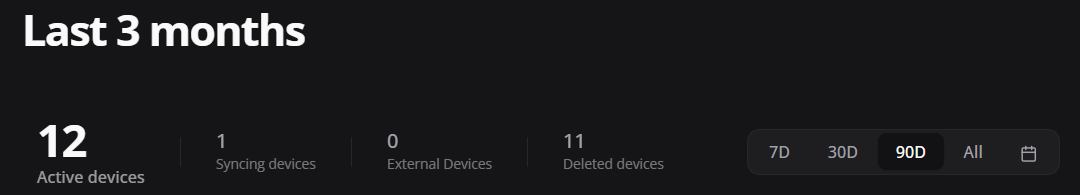
The top of the Dashboard with summary cards and period selector.
This area is used to quickly track the number of active devices, urgent alerts, pending actions and online devices. These indicators show the overall health of the operation before going into details.
¶ ¶ Featured elements
- Analysis period: defines the time window considered by the cards and graphs.
- Total devices: indicates the size of the fleet monitored in the selected tenant.
- Online/offline devices: shows the current communication capacity between the portal and equipment.
- Alerts and pending issues: highlight situations that require investigation by the administrator.
- Indicator cards: work as a starting point for opening equivalent filters in Devices.
¶ ¶ Operational guidance
- Choose the analysis period, read the cards and prioritize investigation when there is an increase in alerts, a drop in online or an accumulation of pending issues. Use these numbers as a starting point for filtering devices in the Devices module.
- Before saving, publishing, or running commands, confirm that the selected company, group, policy, or device matches the desired scope.
The upper area displays totals for the selected period. Period shortcuts allow you to switch analysis between windows such as 7, 30 or 90 days.
¶ ¶ Main indicators
- Active devices: number of active and managed devices.
- Urgent alerts: occurrences that require priority attention.
- Pending actions: commands, configurations or processes not yet completed.
- Online devices: devices that have reported recent activity.
¶ ¶ How to interpret
Use totalizers to understand the overall health of your operation. A drop in the number of devices online, increased alerts, or excessive pending actions typically indicates a need to investigate connectivity, applied policy, or sync failure.
¶ ¶ Device enrollments
¶ ¶ Device registrations
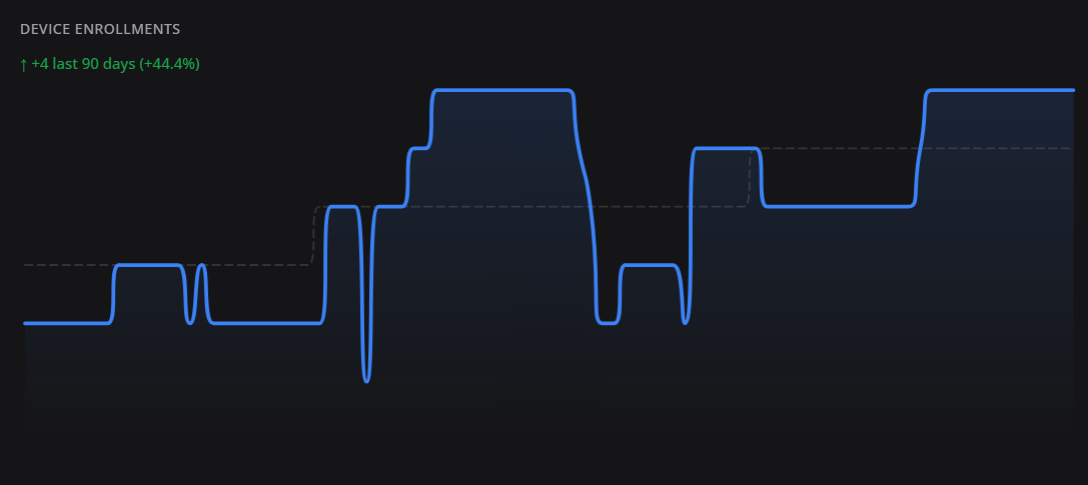
The graph of device enrollments/enrollments in the selected period.
This area is used to validate whether new devices are being registered at the expected rate and whether a mass deployment via QR Code, Zero-touch or KME actually generated new registrations.
¶ ¶ Featured elements
- Registration graph: shows the evolution of new device registrations in the selected period.
- Enrollment spikes: help validate provisioning waves via QR Code, Zero-touch or KME.
- Loss or absence of registrations: indicates a need to review the token, connectivity, Android Enterprise link or activation process.
- Comparison by date: relates planned deployments to records actually created on the portal.
¶ ¶ Operational guidance
- Adjust the Dashboard period and compare the graph peaks with the provisioning dates. If the graph does not grow after a deployment, review enrollment token, connectivity, Android Enterprise bonding, and provisioning policies.
- Before saving, publishing, or running commands, confirm that the selected company, group, policy, or device matches the desired scope.
The Device Enrollments graph shows the evolution of devices enrolled in the period.
¶ ¶ What is it for
- Monitor fleet growth.
- Validate whether a mass deployment occurred as expected.
- Identify periods with a drop or interruption in new registrations.
- Compare registration volume with provisioning actions, such as QR Code, Zero-touch or KME.
¶ ¶ Map
¶ ¶ Dashboard Map
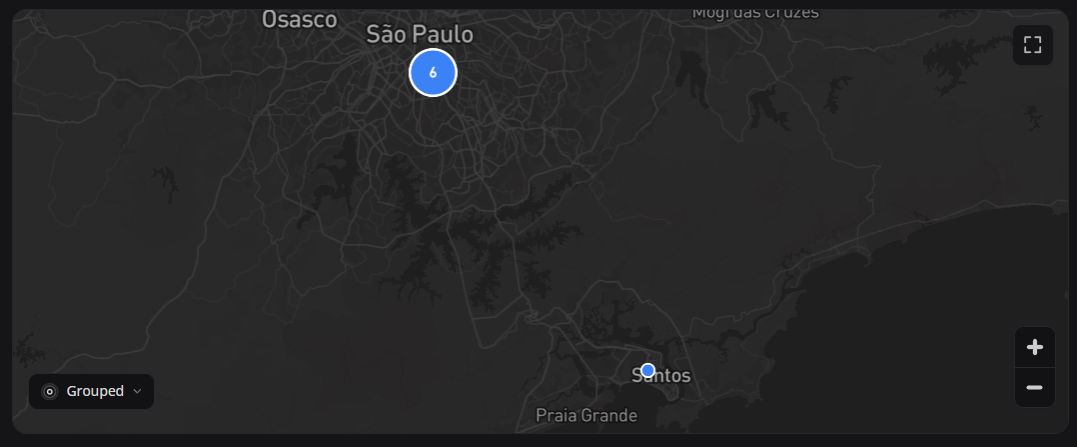
The map with the last known location of devices that reported geolocation.
This area is used to visualize the geographic distribution of the fleet, identify concentration by region and investigate equipment outside the expected area.
¶ ¶ Featured elements
- Geographic map: displays the distribution of devices with reported location.
- Point groupings: indicate concentration of equipment by region, branch or area of operation.
- Zoom and drag: allow you to analyze specific regions with greater precision.
- Devices outside the expected area: help identify improper displacement, loss, theft or allocation error.
- Absence on map: generally indicates disabled location, offline device or lack of permission/connectivity.
¶ ¶ Operational guidance
- Use zoom, drag the map and click on points or groupings to analyze regions. If a device does not appear, verify that location collection is enabled in the policy, that the device is online, and that there is permission/connectivity to report location.
- Before saving, publishing, or running commands, confirm that the selected company, group, policy, or device matches the desired scope.
The map displays the geographic distribution of devices with available location.
¶ ¶ Features
- Zoom and navigation: allow you to zoom in on specific regions.
- Group: Nearby devices can be grouped for easier reading.
- Points on the map: indicate the last known location of devices.
Attention: Location depends on collection settings, permissions, connectivity, and GPS/network availability on the device.
¶ ¶ Fleet overview
¶ ¶ Fleet overview

The Fleet overview card, with an operational summary of the fleet.
This area is used to quickly compare fleet states, such as active, offline, alerted, pending or out of compliance, according to the indicators available in the tenant.
¶ ¶ Featured elements
- Fleet States: groups devices by operational condition, such as active, offline, pending or alerted.
- Comparative indicators: quickly show where there is a greater concentration of risk or pending issues.
- Daily Reading: supports the screening routine before opening the full device list.
- Opening by filter: allows you to transform an indicator into investigation in the Devices module.
¶ ¶ Operational guidance
- Use the card as a daily check. When you notice abnormal volume in any state, open Devices, apply equivalent filters and treat the affected devices by group, policy or last sync.
- Before saving, publishing, or running commands, confirm that the selected company, group, policy, or device matches the desired scope.
The Fleet overview card summarizes the fleet situation. It is useful for quickly tracking whether there are active, offline, failed, or non-compliant devices.
¶ ¶ Recommended use
- Daily review of the operation.
- Validation after applying a new policy.
- Identification of groups with different behavior from the rest of the fleet.
¶ ¶ Devices per group
¶ ¶ Devices per group
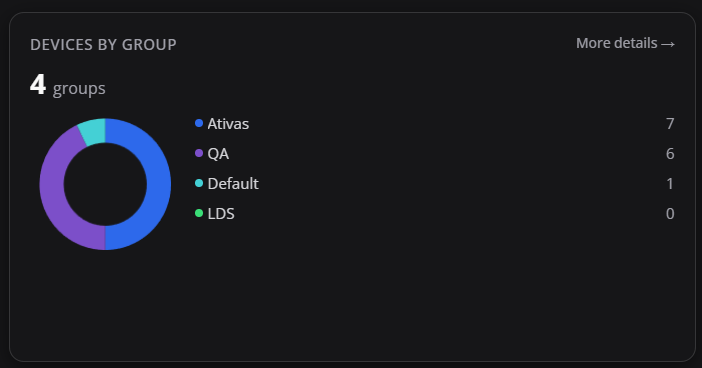
The card that distributes devices by group.
This area is used to understand how the fleet is segmented by customer, branch, project, contract or operational group. Helps you find empty, overcrowded, or misallocated groups.
¶ ¶ Featured elements
- Operational groups: represent customer, branch, contract, project, class, team or any segmentation defined by the company.
- Fleet distribution: shows whether the devices are allocated according to the planned structure.
- Empty or overcrowded groups: signal incomplete registration, incorrect movement or need for inventory review.
- Allocation adjustment: must be made in the device file or by movement action when there is a discrepancy.
¶ ¶ Operational guidance
- Compare the displayed groups with the expected organization structure. If there is a discrepancy, open the device or use allocation actions to adjust group, owner, or related policy.
- Before saving, publishing, or running commands, confirm that the selected company, group, policy, or device matches the desired scope.
The Devices by group card shows the distribution of the fleet between groups. This helps to understand volume by area, customer, branch, project or any segmentation configured on the portal.
¶ ¶ Operating procedure
- Confirm devices are allocated to the correct group.
- Compare groups that should be similar in size.
- Use drill-down to investigate groups with many inactive or out-of-policy devices.
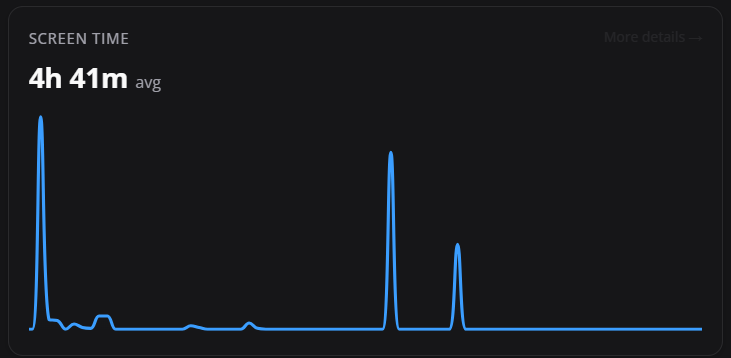
¶ ¶ Screen Time
¶ ¶ Screen Time
The fleet aggregate screen time graph.
This area is used to monitor the intensity of use of devices and detect patterns such as excessive use, low use, working hours that are not expected or equipment that is stopped.
¶ ¶ Featured elements
- Usage metric: indicates how long the devices had an active screen in the selected period.
- Workday pattern: helps detect off-hours use, stopped equipment or excessive use.
- Comparison by date: shows variations in behavior throughout the operation.
- Investigation by device: must be in-depth in the Usage tab of the equipment sheet.
¶ ¶ Operational guidance
- Analyze the period, compare days and identify groups with unusual behavior. To investigate a specific device, open the file in Devices > Usage and compare screen time with app usage and connectivity.
- Before saving, publishing, or running commands, confirm that the selected company, group, policy, or device matches the desired scope.
The Screen Time indicator shows the screen usage time in the period. It helps to understand fleet usage behavior.
¶ ¶ Analysis examples
- Dedicated devices with little use may indicate abandonment, operating problems or lack of connectivity.
- Use above expectations may indicate misuse or need to review permitted applications.
- Variations per day help identify shifts, operational peaks or non-standard behavior.
¶ ¶ Safety and operational attention
¶ ¶ Security
The fleet safety indicator card.
This area is used to view situations such as non-compliant devices, problematic security posture, pending configurations, or events that require administrator action.
¶ ¶ Featured elements
- Compliance indicators: summarize devices at risk, pending configuration or inadequate security posture.
- Critical events: must be handled before low priority adjustments.
- Relationship with policies: allows you to identify whether password, FRP, restrictions, Play Integrity or blocks are applied correctly.
- Latest report: helps differentiate active problem from old information sent by the device.
¶ ¶ Operational guidance
- Review the indicators and treat critical items first. Then go to the applied policy and device profile to check password, FRP, Play Integrity, restrictions and last status report.
- Before saving, publishing, or running commands, confirm that the selected company, group, policy, or device matches the desired scope.
The security card presents events or indicators related to the posture of the devices.
¶ ¶ What to watch out for
- Devices at risk or out of compliance.
- Policy application failures.
- Security features disabled.
- Devices with no recent report.
Tip: Prioritize devices with security risks before treating information-only items.
¶ ¶ Data consumption
¶ ¶ Data consumption
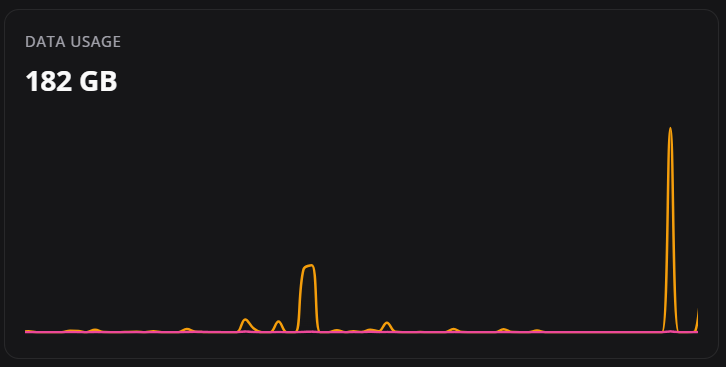
The graph of mobile data/network consumption in the period.
This area is used to identify high consumption, non-standard peaks and possible misuse or apps consuming more data than expected.
¶ ¶ Featured elements
- Tracked volume: shows data consumption in the selected period.
- Traffic spikes: signal heavy synchronization, out-of-scope application or misuse.
- Relationship with apps: must be compared with the data ranking per application.
- Control by policy: can restrict applications, tethering, network, or behavior incompatible with the device's function.
¶ ¶ Operational guidance
- Adjust the period and compare consumption with usage events. To investigate, open the breakdown by app in the Dashboard or the device's Usage tab. Use policy to restrict apps, networking, tethering, or behavior outside of the device's function.
- Before saving, publishing, or running commands, confirm that the selected company, group, policy, or device matches the desired scope.
The Data Usage graph shows the volume of data consumed by devices or applications in the period.
¶ ¶ What is it for
- Identify consumption peaks.
- Find apps that use data more than expected.
- Support mobile chip/data cost analysis.
- Investigate improper consumption or traffic incompatible with the device's function.
¶ ¶ Most used apps by time
¶ ¶ Most used apps by time
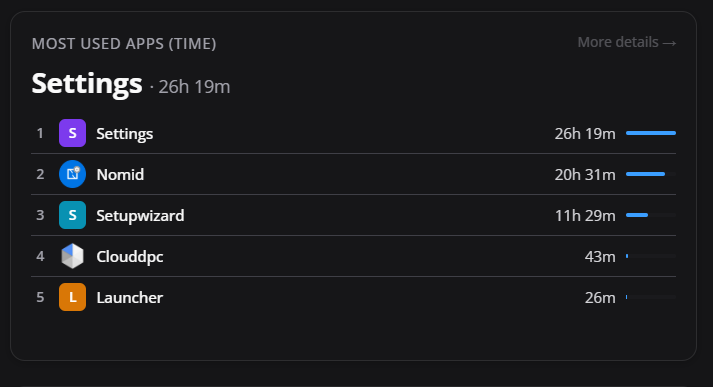
The ranking of most used applications by time.
This area is used to find out which apps concentrate the most usage time in the fleet and confirm whether usage is aligned with the corporate purpose of the devices.
¶ ¶ Featured elements
- Application ranking: orders the apps that have the most usage time.
- Time per app: confirms whether the device's routine adheres to the corporate objective.
- Unwanted apps: indicate the need to review the allowlist, kiosk, launcher and installation rules.
- Analysis prioritization: directs investigation to the applications that most impact productivity.
¶ ¶ Operational guidance
- Observe the apps at the top of the list. If inappropriate apps appear, review the application policy, kiosk/launcher mode, Play Store allowlist and installation rules.
- Before saving, publishing, or running commands, confirm that the selected company, group, policy, or device matches the desired scope.
The Most Used Apps (Time) card lists the apps with the longest usage time.
¶ ¶ How to interpret
- Corporate apps at the top indicate use compatible with the equipment's purpose.
- System apps may appear when the operation uses settings, launcher, camera, browser or support services.
- Apps that are not expected must be compared with the policy applied to the group.
¶ ¶ Most used apps by data
¶ ¶ Most used apps by data
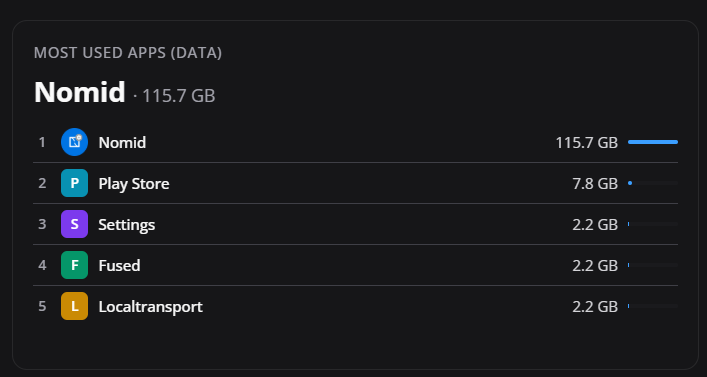
The ranking of applications with the highest data consumption.
This area is used to discover which apps most impact mobile franchise, connectivity and operational costs.
¶ ¶ Featured elements
- Traffic ranking: identifies which applications consume the most mobile or Wi-Fi allowance.
- Operational impact: helps reduce data cost and find excessive synchronizations.
- Heavy applications: must be reviewed in permissions, managed configuration and update policy.
- Corrective action: may involve removing, restricting, blocking or adjusting the app's settings.
¶ ¶ Operational guidance
- Use the ranking to prioritize analysis of heavy apps. If necessary, adjust app policy, set restrictions, remove non-essential apps, or investigate whether your corporate app is syncing too much data.
- Before saving, publishing, or running commands, confirm that the selected company, group, policy, or device matches the desired scope.
The Most Used Apps (Data) card lists the apps that consumed the most data.
¶ ¶ When to investigate
- When an app consumes volume that is incompatible with the device's function.
- When there is a sudden increase in consumption after an application update.
- When mobile data consumption exceeds the contracted allowance.
¶ ¶ App Versions
¶ ¶ Application versions
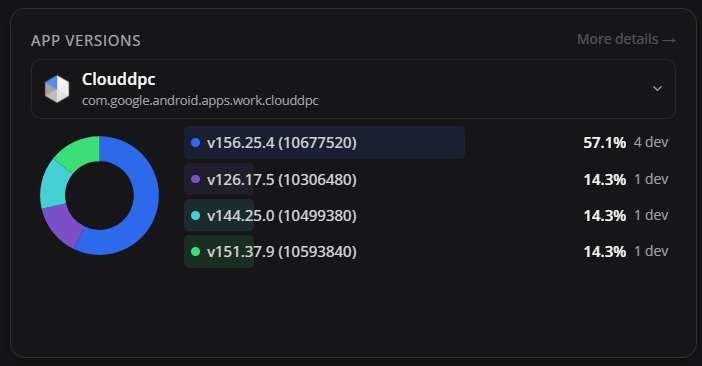
The application version card installed in the fleet.
This area is used to check version dispersion and identify devices that have not yet updated a critical app.
¶ ¶ Featured elements
- Distribution by version: shows which versions of an application are present in the fleet.
- Lag: identifies devices that have not yet updated the expected app.
- Standardization: supports auditing to maintain all equipment in the approved version.
- Correction: must be done by app policy, library or device connectivity check.
¶ ¶ Operational guidance
- Compare the expected version with the listed versions. When there are older versions, review the automatic update policy, availability on Managed Google Play, connectivity and installation status on the device listing.
- Before saving, publishing, or running commands, confirm that the selected company, group, policy, or device matches the desired scope.
The App Versions card shows the version distribution of an application across the fleet.
¶ ¶ What is it for
- Confirm that the update has been distributed.
- Identify devices stuck on old versions.
- Validate whether different groups use different versions due to operational needs.
- Support troubleshooting when a failure occurs only in a certain version.
¶ ¶ Hidden cards
¶ ¶ Hidden cards
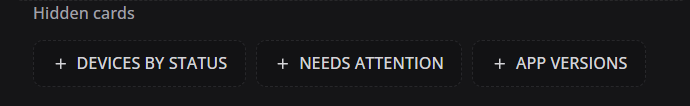
The hidden cards or card customization area of the Dashboard.
This area is used to control which indicators appear in the main view, reducing noise and leaving the most important cards for the operation visible.
¶ ¶ Featured elements
- Available Cards: list indicators that can be displayed or hidden on the Dashboard.
- Vision customization: allows you to highlight only metrics relevant to the operation.
- Hide indicator: reduces visual noise when a metric is not used by the team.
- Redisplay indicator: brings back cards needed in audits, support or temporary monitoring.
¶ ¶ Operational guidance
- Access the card configuration, select or deselect the desired indicators and save the view. Use this to create a leaner Dashboard for support, operations, security or management.
- Before saving, publishing, or running commands, confirm that the selected company, group, policy, or device matches the desired scope.
The Hidden cards area allows you to reactivate cards that have been hidden from the Dashboard.
¶ ¶ Operating procedure
Click on the hidden card you want to bring back. Use this feature to customize the Dashboard according to the team's routine, keeping only relevant indicators visible.
¶ ¶ Recommended follow-up routine
- Check totalizers and urgent alerts.
- Confirm whether devices are falling online.
- Analyze recent enrollments when implementation is underway.
- Review data consumption and most used apps.
- Use map and groups to identify concentration of problems.
- Open the affected device listing in Devices for detailed investigation.